- Loading…
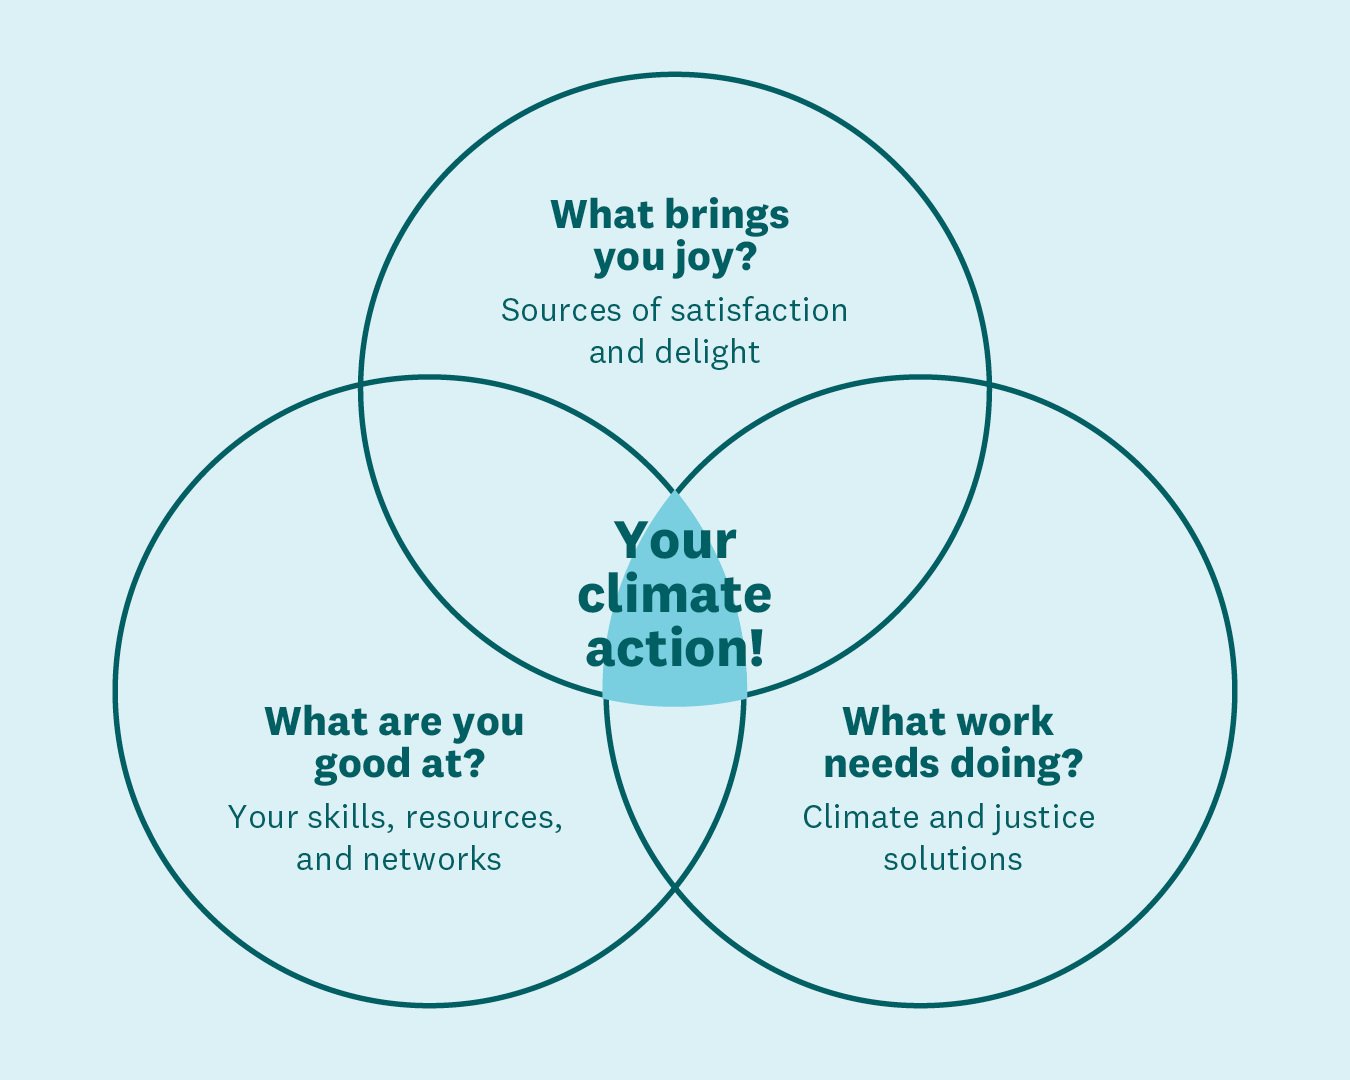
Dr. Ayana Elizabeth Johnson is a leader in science and policy about the Climate Crisis and the health of our oceans. One of her most well known projects is the “Climate Action Venn Diagram.” She asks folks to find the action at the center of three circles: What brings you joy, What are you good at, & What work needs doing?
This lesson is an adaptation of that process focused on younger students solving problems around them with the technology they have in their local makerspace.
Required
Ideal
Start a discussion on what problems students see in their communities.
Discussions about the Climate Crisis can often have students feeling powerless, especially with younger students. Start by describing problems that were difficult, but we worked hard to solve. Closing the Ozone Layer and Bald Eagle populations are two great examples.
Whatever you decide to start this conversation with, it is important to say “All solutions are when many people come and work together to solve a problem.”
Continue the conversation by having students identifying problems they see in their community. Guide the conversation towards small, actionable problems.
Students create a Venn Diagram with things they can make and solve.
Say “While there are many different ways we can brainstorm solutions, Dr. Ayana Elizabeth Johnson has a great Diagram that we can use as a starting point.”
Explain what a Venn Diagram is. “Dr. Ayana has three circles in her Diagram.
As a Marine Biologist and Climate Policy Maker, her work is focused on the Climate Crisis. We are going to focus on more local problems today, but in the future feel free to use this to think about global problems.”
Allow students to create a draft of their diagrams. They can work in groups or individually. Make sure to remind them of the tools they have in their makerspace, such as 3D printers or Laser Cutters.
Students make their Venn Diagrams and present what they want to work on.
Allow students time to fabricate examples on their Diagrams. This could be example projects from machines they can use or even prototypes of solutions to a problem. The timeframe for this can be as short as 15 minutes or as long as a week.
Once everyone is ready, allow students to present their Diagrams to the class. Even though the “lesson” is finished after this discussion, make sure to follow up with students at a later time to see what actions they have taken towards solving the problems in their community.
Having trouble? Let us know by completing the form below. We'll do our best to get your issues resolved quickly.
"*" indicates required fields