- Loading…
In this lesson, students will explore the relationship between heart rate, physical activity, and emotions using a pulse sensor and an RGB LED. By integrating biology, physics, and programming, students will measure their pulse, analyze how physical exertion or stress affects heart rate, and modify a microcontroller-based system to display real-time feedback.
Through hands-on coding, students will customize the LED colors to represent different pulse rates and add personalized messages in Armenian when no pulse is detected. The activity encourages interdisciplinary collaboration, as it involves elements of science, computer programming, and physical education.
The lesson fosters critical thinking, problem-solving, and data interpretation, making learning both interactive and applicable to real-life health monitoring.

This lesson was an exciting and interactive way to combine biology, physics, and programming. Students were fascinated by how they could measure their heart rate using a pulse sensor and visualize the data with an RGB LED. They actively participated in testing their pulse before and after physical activity and were eager to see how their heart rate changed.
Challanges
Some students struggled to get a stable pulse reading. To address this, I guided them on proper finger placement and sensor sensitivity.
A few found the coding part complex at first, especially understanding how the RGB LED changed color based on heart rate. However, as they experimented with the code, they gained confidence.
Since we couldn’t test the entire class, I worked with a small group and shared their results with others. Next time, I would plan for a larger-scale experiment.
“Որտեղ է քո մատը?” (Where is your finger?) when no pulse was detected.
Collaborating helped students connect heart rate with physical activity and emotions.
The lesson showed how technology can be used in health monitoring, making it a real-world, interdisciplinary experience.
The project inspired discussions about wearable tech, fitness trackers, and medical devices.
Ask a question “What happens to our heart when we run? Or when we’re nervous?”
Brief discussion to activate prior knowledge.
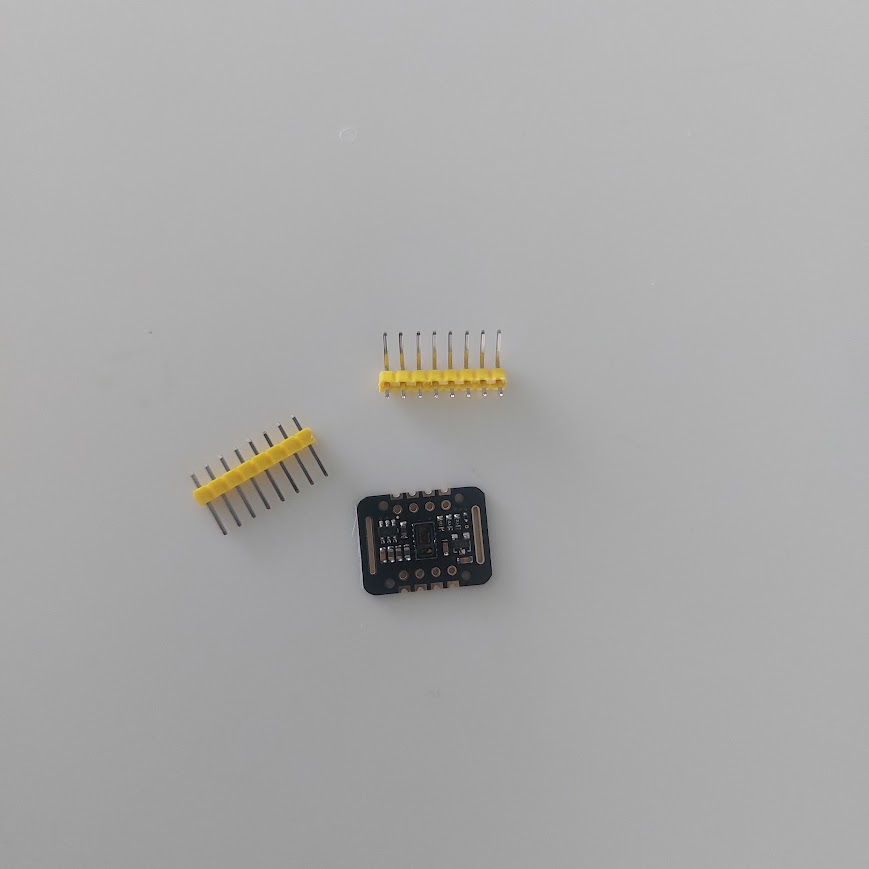
Show the pulse sensor and RGB LED setup.
Explain each component and the goal: visualizing heart rate with color.
Connect the RGB LED:
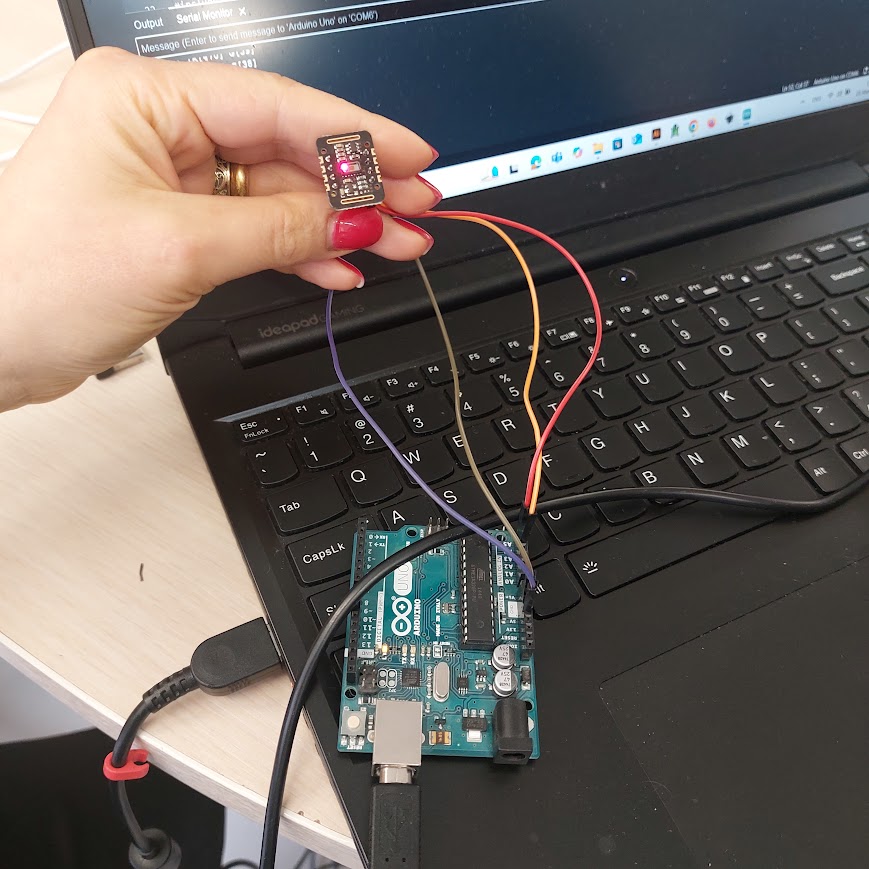
Guide students in connecting the sensor and LED to Arduino. See connection diagram below. Connect the Pulse Sensor to Arduino: VCC → Connect to 5V GND → Connect to GND Signal (S) → Connect to A0
See connection diagram below.
Students upload the sample Arduino code.
They test it by placing a finger on the pulse sensor and watching LED changes.
Upload and Test the Code:
If the pulse is more than 65- blue
if the pulse is less than then65- green
Ask students to customize the code—change LED thresholds.
Students will add a message in Armenian when no pulse is detected.
Where is your finger?
Small group discussions: “What did your heart do after activity?” “What does the color mean?”
Share creative modifications.
Having trouble? Let us know by completing the form below. We'll do our best to get your issues resolved quickly.
"*" indicates required fields