- Loading…
In this lesson students create their own miniature Secchi disk with a 3D printer and will use these tools to measure turbidity, and thus water quality, of different water samples. They will understand how to use an actual Secchi disk in the field, in order to determine the depth of the photic zone in different bodies of water.
Teacher Note:
This lesson assumes educators have an introductory level of experience with 3D printers. If teachers have limited or no prior experience, they should use prep periods to explore this tool. For questions, feel free to reach out to local Fab Lab managers.
Digital Fabrication Software & Equipment
3D printer with white filament: have them add a thin line to separate the 4 pie-shaped wedges
How to use TinkerCad video: https://www.youtube.com/watch?v=sh4o9k599pQ&ab_channel=MatterHackers
Additional Materials:
Introduce students to key terms and concepts using these lesson plans.
As a warmup/ DO NOW activity, have students define these key terms:
Turbidity
Water Column
Photic Zone
Water Quality
Dissolved Oxygen
Ask for volunteers to share their definitions with the class. Show visuals/ diagrams for each term. Discuss the impact of turbidity on aquatic life; acknowledge that there is an inverse relationship between the turbidity and the depth of the photic zone within a body of water.
Tell students to make a hypothesis about which water source (from the samples you have collected) will have the highest turbidity, and why.
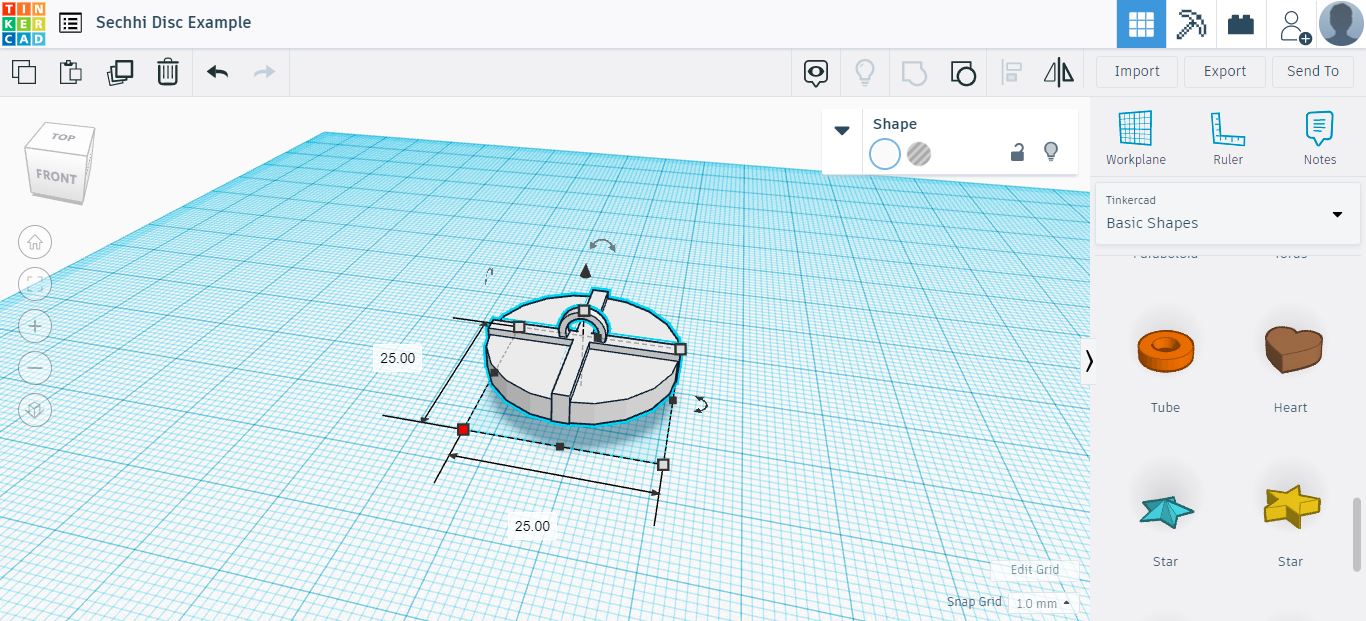
Create miniature Secchi Disks using TinkerCad and 3D printers.
Have students observe actual Secchi Disks (8 inch diameter) as well as videos of scientists using Secchi Disks in the field.
Explain the procedure for how to measure the depth of the photic zone in a body of water, as well as how to judge relative turbidity from different water sources.
Show that temperature can also be measured easily by attaching a thermometer to the cord of the Secchi Disk, just above where the black and white disk is attached.
Have students use these observations to design their own mini version of the Secchi Disk tool. Provide them with the diagram below to visualize the color scheme and design,
in which B = Black
the alternate wedges are white 3D printed material
Red dot = the position of both rings on top and bottom to hold the string and weight, respectively
Provide support for each group of students as they use Tinkercad software to design their mini Secchi Disk.
SAFETY: Only those trained on the 3D printer should operate the machine. While the 3D printer is in operation, keep all body parts, hair, and loose clothing clear of the machine. People using the 3D printer should always stay close by the machine while it is running to monitor its function.
Students will finish coloring their mini Secchi Disks and use them in a water quality laboratory investigation.
After the mini Secchi Disks are produced from the 3D printer, use the polyurethane (see Additional Materials, above) to coat the surface of the entire object. When dry, have students use black paint or black sharpie marker to color in the “B” wedge surfaces on their disk. Help students attach a ball bearing to the bottom of their disk and tie the string to the top of the disk.
When students are ready to begin the lab exploration, introduce them to the 3-4 water samples you collected (the identify of these water sources will remain UNKNOWN to students for now). Each group of students will put their mini Secchi Disk into a graduated cylinder containing one of the unknown water samples. They will place the graduated cylinder on the floor below them so students can easily lower the Secchi Disk into the cylinder and observe its appearance as it descends into the water column. Tell students to record their observations and the actual depth (volume, in mL from the side of the graduated cylinder) in their data table.
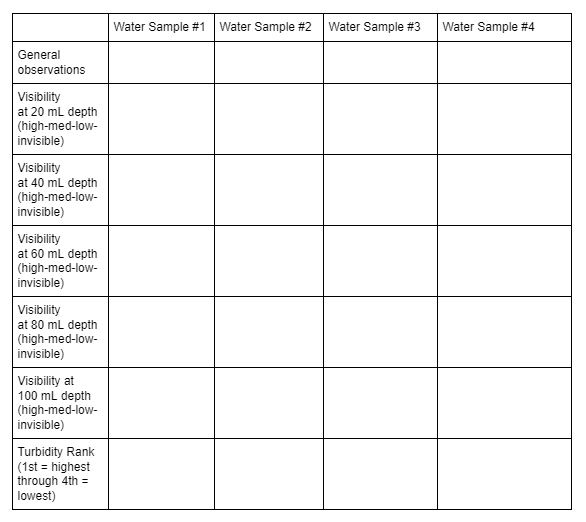
Students will collect, record, and analyze their turbidity/ Secchi Depth data from each of the water samples in the lab exploration.
Share with students this data table:

Tell students to restate their original hypothesis. Ask them to determine whether it was proved true or false by the data. Ask them to analyze their results and make suggestions as to where each water sample might have been collected from. Discuss these questions:
If possible, plan a local field trip to a river, stream, lake or ocean, where students can use an actual Secchi Disk (in addition to other water quality tools such as Dissolved Oxygen kit, temperature, macroinvertebrates collection net, nitrates/ phosphates kit, plankton tow net, etc.) to analyze the water quality of their local environment.
Having trouble? Let us know by completing the form below. We'll do our best to get your issues resolved quickly.
"*" indicates required fields