- Loading…
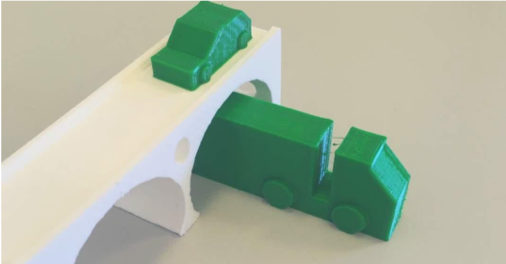
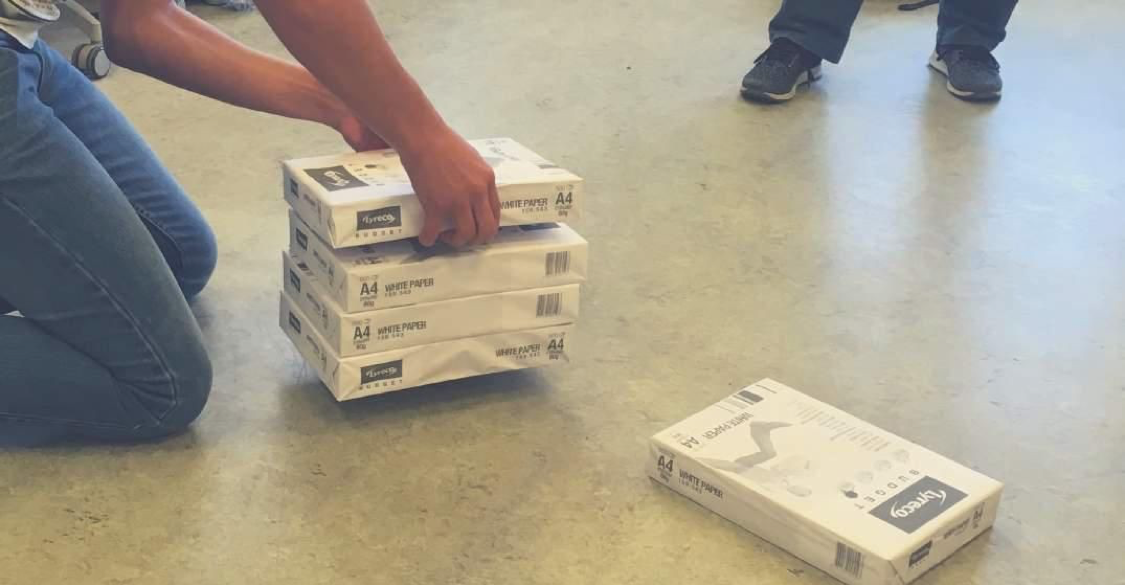
In this lesson, students are guided in a structured learning activity (building a 3D bridge). Students go through an iterative process to learn how designs can be developed and improved over time. The core project is building highway bridges. In this learning activity, teams of 2-3 pupils worked on designing bridges. The bridges should accommodate four lanes of traffic under it, and two lanes over it, and the design should be built in 1:500 scale. Afterwards, students test the strength of each bridge by placing weights on top of it until the bridge breaks.
Materials List
Design Files Developed:
Car Model – Bil.stl, Truck (12).stl
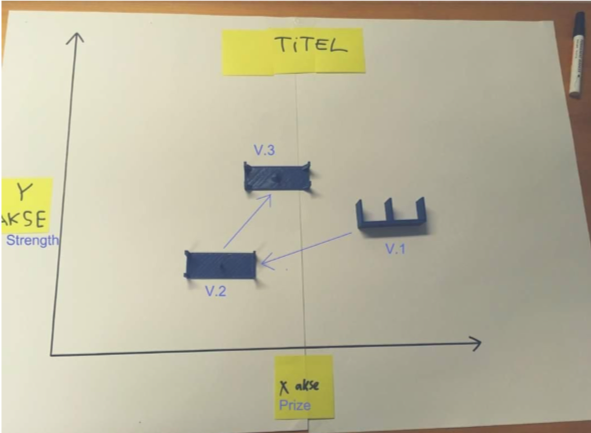
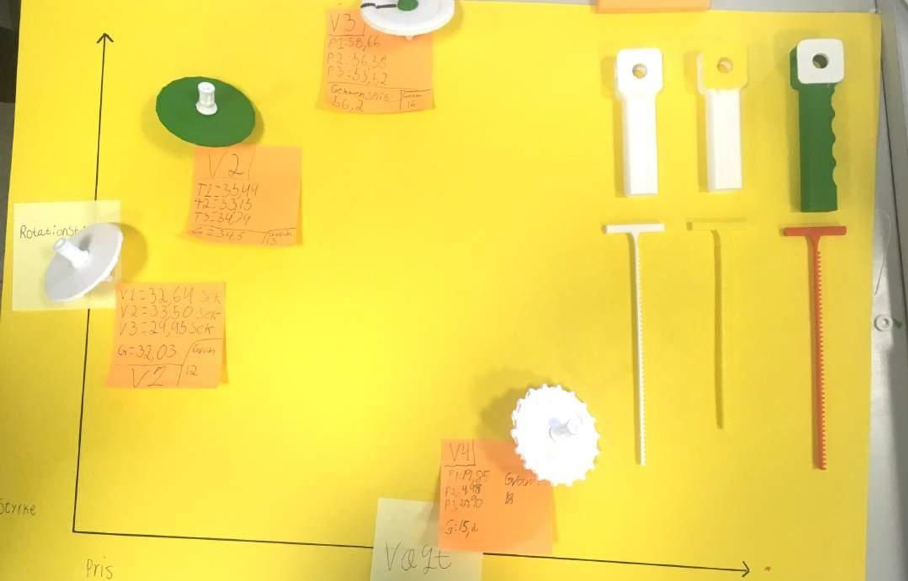
Step One: Making the Coordinate System
TEACHER NOTE: The easiest way to use the coordinate system is to give the students two parameters in the design task (e.g. strength and price) and create the axes. These constraints should give the students a direction but not an ultimate goal, by giving them a direction students will always have the possibility to improve their design. This type of design task and way of using a coordinate system increase the students’ abilities to problem solve. The coordinate system can also be used to construct knowledge.
TEACHER NOTE: (Optional Anticipatory Set) Before class, review and print copy of Activity 1 for each student: Coordinate Place Four and Independent Worksheet 1: Coordinate Dot-to-Dots. Found in the Math Learning Center, Bridges in Mathematics, https://www.mathlearningcenter.org/sites/default/files/pdfs/SecB4SUP-C5_GeomCoordSys-201304.pdf
Essential Question: What are Cartesian Coordinates? What is the origin of the name?
Fun Fact: This lesson plan is named after the French natural philosopher and mathematician Nicole Oresme, who used cartesian coordinates before Descartes, from whom they get their name. Oresme used the coordinate system to plot physical attributes, observed in nature, whereas Descartes used it to describe and understand principles of algebra.
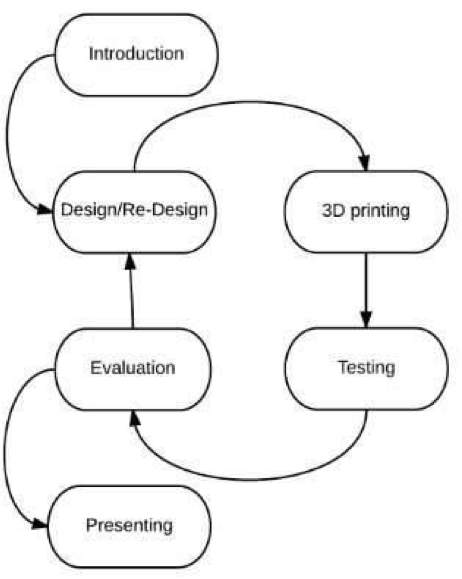
Step Two: Introduce the Iterative Design Process
Essential Question: How can you use the iterative process to construct knowledge to improve designs?
TEACHER NOTE: Keep the introduction as short as possible, the students need to create their own experiences and will learn through this. However, sharing some information at the beginning is essential. Review “The Iterative Designer: An approach for structuring a learning activity with a 3D printer, (Reference Iterative Design PDF )
Explain the Goal– Inform students that the goal of the lesson is to go through an iterative process. Students will learn how designs can be developed and improved over time. The teacher will guide the pupils through six phases and help them construct knowledge to improve their design. First introduce the students to the design task. Hereafter, the pupils will begin the iterative process and design a solution. (see Chart on p. 1 of Iterative Design handout).
Introduce the Process -Before students start, they need to know that they will be working through several
iterations, and that the learning activity extends beyond the initial print. Explain to them how they are going to design, print, test, and evaluate their bridges several times, Students also need to know what to do in each phase and how much time they have, in order to regulate their process themselves.
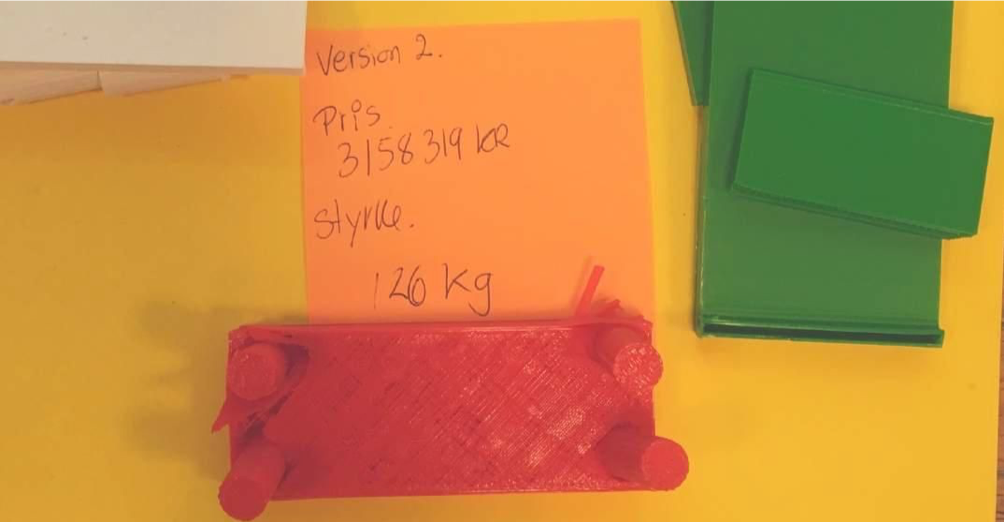
Introduce the Task – Finally students need to know the design task and which problem they are solving. Finding a good design task can be hard, and several considerations are necessary. First of all, it is an advantage if the object is small and fast to 3D print, being able to print each iteration within an hour is an advantage. Furthermore, the task should be to solve a problem, but with multiple possible approaches. This can be easier if the task contains some constraints or goals which gives the pupils a direction for their design. Introduce the actual coordinate system you will use for analysis in step five so the students know what the goals are: price and breaking weight are the 2 axes in the coordinate plane.
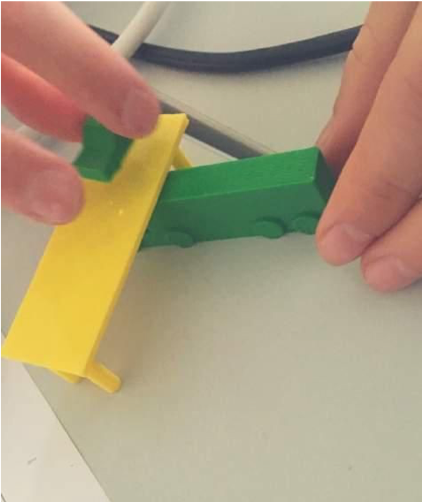
“In this task students will design a highway bridge where two cars can drive over the bridge and four trucks, two in each direction, can drive under. The bridge must be as strong as possible to avoid accidents and collapses, however, the price must also be taken into account.”
Step Three: Calculate the price
TEACHER NOTE: There are several different approaches to calculating the price of a bridge. In this lesson, we start by finding the volume of the print, by seeing the 3D printer as a machine which arranges a long cylinder (the filament) into a new shape (the design). When starting the 3D printer the program will most likely inform you about the length of filament which will be used on this design, and the height (h) of the cylinder. On the spool of filament you can find the diameter (most likely 1,75mm or 2,85mm), which can be converted into the radius (r).
V model = π · r2 · h
Since the bridge is designed in 1:500 scale (s) on all three axes:
V bridge = π · r2 · h · s3
The next step is to multiply the volume of the real life bridge with the price (p) of the material in which the bridge will be built. This lesson used the price of Steel Fiber Concrete on 1.831 Danish Kroners pr. m3
P bridge = π · r2 · h · s3 · p
Example: With a filament radius (r) of 0,00175 meters (Converted from mm to keep units the same), and 2,5 meters of filament used (h), a scale factor of 1:500 (s), and a price per m3 alculation will be as follows:
![]()
And the price of materials for building this bridge in real life is 191.406$.
TEACHER NOTE: When adapting lesson, teacher should decide to price materials to construct a bridge in real life.
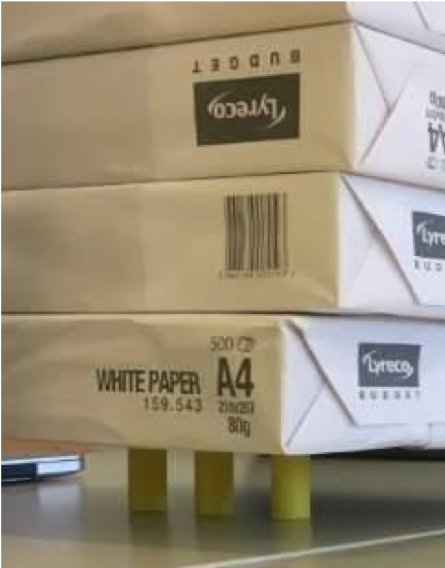
Step Four: Test the strength
Step Five: Evaluating and Presenting
Essential Question: How does failure improve the design process?
TEACHER NOTE: This is usually the time where the teacher can have very interesting and deep conversations with the student, where knowledge construction can be achieved. Remember not to give your own suggestions on how exactly to improve the design, but have the pupils discover this for themselves.
Step Six: Presentation
Formative Assessment: Students will be able to explain the process they used to determine the type of bridge that would work best; how they constructed it; and the results of their weight load test.
More documentation on Facilitation / Procedures: The iterative designer.compressed.pdf
Having trouble? Let us know by completing the form below. We'll do our best to get your issues resolved quickly.
"*" indicates required fields