- Loading…

Spirograph is the name given to a drawing tool that makes “mathematical roulette curves” known as hypotrochoids.
In this lesson, you will learn how to use Python Turtle* to create a digital Spirograph, which will generate a Spirograph design, and convert that drawing into an edible pancake!
The lesson will provide the base code for the major elements of working with the Python Turtle library as well as the coordinate conversion to G-Code. Students will learn how to represent different curves and approximate them with short line segments and changes in the heading of the Turtle drawing tool.
*Turtle graphics is a popular way for introducing programming to kids. It was part of the original Logo programming language developed by Wally Feurzig and Seymour Papert in 1966.
For more information visit. https://docs.python.org/3/library/turtle.html#turtle.screensize
SAFETY FIRST
When operating the PancakeBot, there are few precautions one must take.
You will start off the lesson by running a Python Program that draws a spiral and exports the coordinates of the lines to G-Code. You will then print the pancake from the G-Code file.
Run the Python Program named OneSpiral.py. Watch and observe how the turtle draws out the spiral pancake. When the turtle is complete with drawing the pancake, save the GCODE file and copy it to your SD card for printing to the PancakeBot.
The colors of the path the turtle takes corresponds with the rest of the guide.

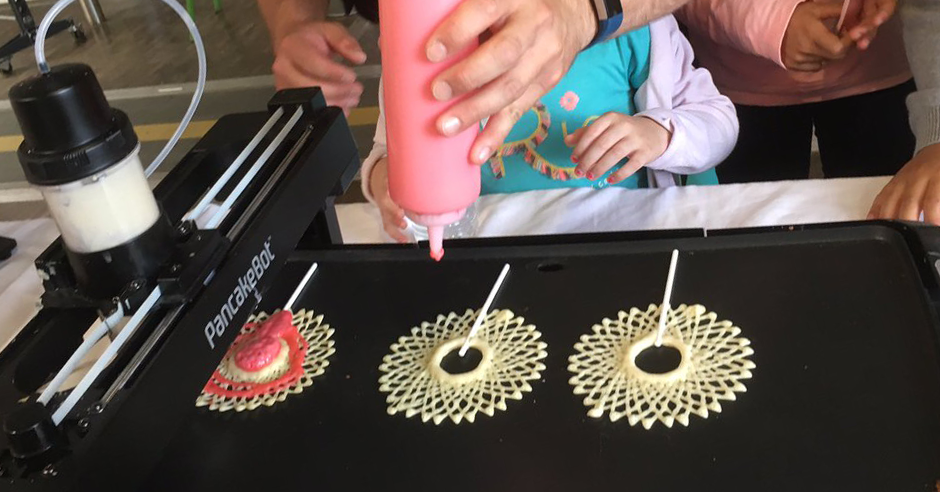
This will be the resulting pancake from the code.

A Spirograph creates elaborate spirals by using different shapes that spin in or around each other. Although there is a lot of geometry and mathematical calculations that can be used to achieve the desired spiral, we can use short straight lines drawn in Python Turtle to approximate those spirals with a few lines of code. One of the ways to do this is to hand draw your own spirograph and observe the critical movements needed to generate the design. You will hand draw or trace the curves created by the petals of a daisy and track the steps involved to make those curves.

Figure 1: A daisy flower detailing the different types of petals, or florets, of the flower.

Figure 2: Traced curve 1 over floret. With first Δ1 angle turn.

Figure 2: Traced curve 2 over floret with Δ2 angle turn.

Figure 2: Traced Curve 1 over floret with Δ3 angle turn.
Now that we have observed a spirograph in nature, and documented how to draw one, we will look at how the programmed code works. Here you will write pseudo code to draw your spiral. Afterwards, we will combine Pseudo-code for drawing the griddle and outputting to G-Code.
For this portion of the code, we will create a function that draws several lines to approximate the two curves, and then repeat that 36 times.
Our first consideration is a statement of what the function does.
Line 1:
This program will allow the user to draw a spirograph curve by first drawing a set of curves, then repeating those curves in a pattern around a circle.
Now we will create a sequence of tasks to do that.
One way to draw a curve is to approximate the curve with a bunch of smaller lines.
Figure 1: A curve with approximation lines created by different amount of sub divisions.
Figure 1 shows how a curve can be approximated by short straight lines by sub dividing the curve into smaller sections, and connecting those end points. In this example, we can get pretty close to the curve withjust 8 straight lines, and a change in direction of ΔC between every straight line (only the bottom 4 are shown). This process is called curve fitting with segmented lines and is used in many ways such as helping understand statistical data.
Because we have to draw many florets, we should create one function that repeats over and over again.
Line 2:
Create a function called “draw_floret” that draws an individual floret using 8 segmented lines.
Our next line of Pseudo-code will need to give the Turtle a specific heading to
To start the next curve, we will need to point the Turtle in the right direction.
Line 3:
Change heading of Turtle by the Δ1 degrees.
Line 4:
Repeat 8 Times(
Draw a straight line from point 1 with a distance of x then change the heading of the Turtle by ΔC degrees)
That will give us our first curve, then we will need to change the heading of the Turtle dramatically to make the second curve.
Line 5:
Change heading of the Turtle by Δ2 degrees.
Now we will draw the same curve as before.
Line 6:
Repeat Line 2:
Using Pseudo-code, we have drawn our first daisy floret!
To draw the complete flower, we need to draw 36 florets, so we will repeat the the floret function 36 times.
Line 7:
Repeat draw_floret function 36 times.
Putting it all together, the Pseudo-code should look something like this:
This program will allow the user to draw a spirograph curve by first drawing a set of curves, then repeating those curves in a pattern around a circle.
Create a function called “draw_floret” that draws an individual floret using 8 segmented lines.
Change heading of Turtle by the Δ1 degrees.
Repeat 8 Times(
Draw a straight line from point 1 with a distance of x then change the heading of the Turtle by ΔC degrees)
Change heading of the Turtle by Δ2 degrees.
Repeat 8 Times(
Draw a straight line from point 1 with a distance of x then change the heading of the Turtle by ΔC degrees)
Repeat draw_floret function 36 times.
While Python Turtle deserves its own lesson plan and has a myriad of uses, we will be focusing on a few key commands that will allow us to draw and take cordinate information from lines in Python Turtle. We'll learn about those commands, and then you will look at the code that creates the spirals, and start making changes to it to see how it runs.
Here are the command you will use when drawing your curves.
pencolor() Changes the color of the line.
i.e. turtle.pencolor(“brown”)
Changes the pen color to brown
pensize() Changes the width of the line.
i.e. turtle.pensize(3)
Changes the pen size to 3 pixels wide
right() Changes the direction of the heading of the turtle by given clockwise degrees. i.e.
turtle.right(60)
Changes the direction of the heading of the turtle by 45 degrees in the clockwise direction.

left() Changes the direction of the heading of the turtle by given counter-clockwise degrees. i.e.
i.e. turtle.left(45)
Changes the direction of the heading of the turtle by 45 degrees in the counter-clockwise direction.

forward() Moves the turtle forward by a given amount
i.e. turtle.forward(56)
Moves turtle forward 56 units

xcor() Tells you (returns) the x coordinate of the current location of the turtle.
i.e.
##if the turtle is at coordinates (4,10)
print (turtle.xcor())
will return and display 4
ycor() Tells you (returns) the y coordinate of the current location of the turtle.
i.e. turtle.ycor()
i.e.
##if the turtle is at coordinates (4,10)
print (turtle.xcor())
will return and display 10
Now that we have a general understanding of the workflow, as well as some general turtle commands, we'll inspect the code. Remember, we just touched the tip of the iceberg when it comes to how the code works, so there are more commands in the final program than we covered above.
##This program creates spiral daisy pancake designs and exports the coordinates of those points to a properly configured G-Code file that PancakeBot can read.
import turtle ##Import Turtle Library
import random
import math
turtle.screensize(460,460) ##Create the screen for drawing your objects on
turtle.setworldcoordinates(0, 0, 460, 400)
turtle.shape(“turtle”) ##Select the shape of the character, in this case, a turtle
turtle.speed(10) ##Set the travel speed of the turtle
##Change these variables to change what the flower pancake looks like.
myFloret_Length=50 ##Length of the Floret in mm
myDelta_C=8 ##Number of Bends to divide Floret curve into. Higher Number is smoother, lower number is choppier
myFloret_Tip_Angle=115 ##This is the angle at the tip of the floret
myFlorets=40 ##Number of florets
new_floret_angle=180 ##Angle between florets
##This is the space between the pancakes
mySpace = 100
##this creates two arrays to store informaiton in.
myNewCoords=[]
myNewCoords2=[]
#This is the approximate Width and Height of the printing area on the griddle.
griddleWidth=460
griddleHeight=260
##These commands draw the pancake griddle.
turtle.begin_fill()
turtle.forward(griddleWidth)
turtle.left(90)
turtle.forward(griddleHeight)
turtle.left(90)
turtle.forward(griddleWidth)
turtle.left(90)
turtle.forward(griddleHeight)
turtle.end_fill()
##This is a function that draws the floret
def draw_floret():
turtle.pencolor(“BLUE”)
turtle.pensize(4)
for i in range (0, myDelta_C):
turtle.left(myDelta_C)
turtle.forward(myFloret_Length/myDelta_C)
myNewCoords.append(‘G00 X’+ str(round(turtle.xcor(),2))+’ Y’+str(round(turtle.ycor(),2)))
turtle.left(myFloret_Tip_Angle)
turtle.pencolor(“RED”)
for i in range (0, myDelta_C):
turtle.left(myDelta_C)
turtle.forward(myFloret_Length/myDelta_C)
myNewCoords.append(‘G00 X’+ str(round(turtle.xcor(),2))+’ Y’+str(round(turtle.ycor(),2)))
def draw_Daisy():
for i in range (0, myFlorets):
draw_floret()
turtle.right(new_floret_angle/2)
turtle.forward(myFloret_Length*math.pi/18)
myNewCoords.append(‘G00 X’+ str(round(turtle.xcor(),2))+’ Y’+str(round(turtle.ycor(),2)))
turtle.right(new_floret_angle/2)
##This function takes the coordinates from created with the drawPancake function, and outputs them to the G-Code File
##It adds (appends) the necessary G-Code text to create the file.
def writeGCode():
newFile = input(‘Enter the name of the GCodeFile’)
GCodefile = open(newFile+’.Gcode’, ‘w+’)
GCodefile.write(‘G21; sets units to millimeters \n’)
GCodefile.write(‘M107; Turns extruder off \n’)
GCodefile.write(‘G28; Home all axes \n’)
GCodefile.write(‘G1 F5600; Sets the speed of PancakeBot \n’)
GCodefile.write(‘M107; \n’)
GCodefile.write(myNewCoords[0]+’\n’) ##Goes to the first coordinate point.
GCodefile.write(‘M106; \n’)
GCodefile.write(‘G4 P1000; \n’)
for i in myNewCoords:
GCodefile.write(i+’;’)
GCodefile.write(‘\n’)
GCodefile.write(‘M107; Turns extruder off \n’)
GCodefile.write(‘G4 P1000; \n’)
GCodefile.write(‘G00 X10 Y10; Cruises back to almost home\n’)
GCodefile.write(‘G28 X0 Y0; Home all axes \n’)
GCodefile.write(‘M84; Disable motors \n’)
GCodefile.close();
turtle.penup()
turtle.setposition(griddleWidth/2,griddleHeight/2) ##This sets the start position of the turtle to the middle of the griddle
turtle.seth(80)
turtle.pendown()
draw_Daisy()
turtle.penup()
myConfirmation = input(‘Do you want to save the GCode File? Enter Yes or No ‘)
if myConfirmation == ‘Yes’:
writeGCode()
print(“You have opted to save your file. It will be stored in the same directory as the OneSpiralTurtle.py program”)
else:
print(“You have opted not to save your file. Run the program again to save your file. Thank You!”)
Having trouble? Let us know by completing the form below. We'll do our best to get your issues resolved quickly.
"*" indicates required fields